Retaining customers is as important as acquiring new ones, especially given the costs associated with customer acquisition.
The subscription model has gained adoption in the last few years, especially in the software industry with companies like Tableau, Salesforce, Adobe, Autodesk, and others.
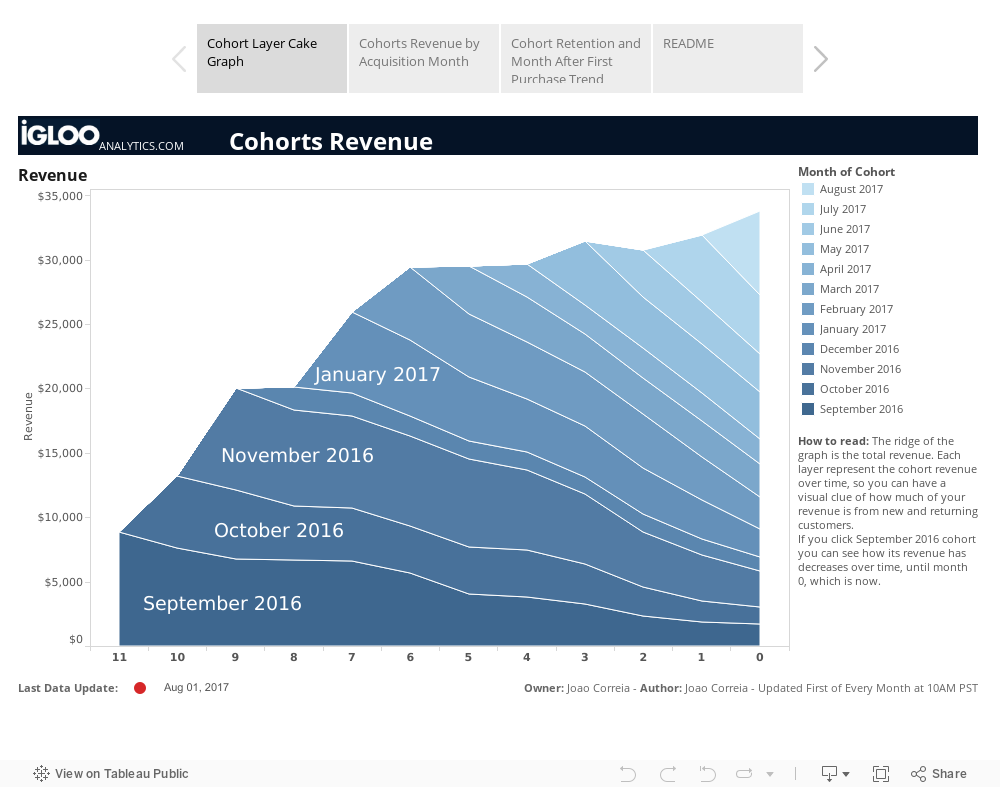
This article explains how to perform cohort analysis to evaluate the performance of your marketing retention and acquisition efforts.
If you are in a rush to see the final result, feel free to interact with live dashboard below.
Motivation for Cohort Analysis
What is the impact of our marketing retention/acquisition efforts?
One approach is to use ARPU (Average Revenue per User), dividing the revenue by the number of customers for that period. However, ARPU poses two problems:
- It doesn’t account for the age of customers
- New customer acquisition can mask a retention problem
Observe the following charts below with the number of customers, each paying $10:

Notice how the ARPU in July 2016 is the same as in July 2017. Still, in 2016 70% of the customers were repeat purchases while in 2017 70% were new, still the ARPU is the same $1000/100 = $10.
Above is an example of how customer acquisition can mask a retention problem.
Cohort Analysis
Cohort analysis is customer centric, it enables you to compare customers in the same stage of the customer lifecycle, since their cohort is defined by their acquisition date.
Imagine the situation described in the table below. Your Dec 2016 campaign brought new customers who spent on average $80.
In 2017 your campaign brought new customers who spent on average $90.

Just analyzing month 0 (ARPU approach), one could say that the Dec 2017 campaign was more effective than the Dec 2016, but notice how the ARPU (Average Revenue per User) sustains more revenue for the Dec 2016 cohort.
After five months on the date of acquisition, the Dec 2016 cohort average total is $180 per customer while the Dec 2017 is $151.
Now you are aware that the customers acquired in 2017 were not the same quality as the ones in Dec 2016.
Step 1: Collecting the data
To build a cohort analysis, you will first need sales or website visit data over time with one metric and a unique identifier for each customer.
The following fields are required:
- date
- user_id
- revenue
Tip
Step 2: Data Modeling for Cohort Analysis
Events/Sales Table
The events table is the main table for our cohort analysis; it contains the mandatory fields: date, user_id, and revenue.
CREATE TABLE events (
  "date" date not null,
  "user_id" int,
  "name" varchar(255),
  "acquisition_channel" varchar(255) encode text255,
  "revenue" float);
Cohort Definition
This view defines the cohort as the date (month) of the first purchase, or the first time we've seen a particular user_id.
/* Cohort defined by first purchase */
CREATE VIEW cohort_dfn_by_month_first_purchase AS
  SELECT
  user_id,
  DATE_TRUNC('month', MIN(date)) as cohort
  FROM events
  GROUP BY 1;
Metric Definition
This view define the metric for each customer with date and revenue for each month.
/* Months a user has been active and sets a value for each month revenue */

CREATE VIEW retention_by_user_by_month AS
  SELECT
  user_id,
  DATE_TRUNC('month', date) AS months_active,
  SUM(revenue) AS revenue
  FROM events
  GROUP BY 1,2;
Cohort+Metric Definition
The final view joins the cohort definition with the metrics.
/* This view joins the cohort with the metric view. */
CREATE VIEW cohort_retention_by_month_first_purchase AS
  SELECT
  cohort,
  m.months_active AS month_actual,
  SUM(m.revenue) AS revenue,
  RANK() OVER (PARTITION BY cohort ORDER BY months_active ASC)-1 AS month_rank,
  RANK() OVER (PARTITION BY cohort ORDER BY months_active DESC)-1 AS month_rank_trend,
  COUNT(DISTINCT(c.user_id)) AS subscribers
  FROM cohort_dfn_by_month_first_purchase c
  JOIN retention_by_user_by_month m
  ON c.user_id = m.user_id
  GROUP BY 1,2
  ORDER BY 1,2;
Step 3: Using Tableau for Cohort Analysis
Download the Tableau Public workbook, open it in Tableau Desktop and replace the cohort_retention_by_month_first_touch (public) data source with your SQL server view (cohort_retention_by_month_first_purchase) created on step 2.
Gather your team and discuss the findings.
Conclusion
Cohort analysis is a simple, yet effective way to understand the performance of your marketing retention and acquisition efforts.
Looking for a help with customer analytics? Contact us!.
What's your experience with cohort analysis?
Share your view in the comments section below.